
Why College Football Keeps Rewriting the Betting Script
College football is not simply a Saturday sport; it is a market where schedule strength, roster turnover, coaching changes, conference realignment, and College Football Playoff pressure continually reshape the value of every matchup. The 2026 FBS season runs from late August through championship season, with Week 1 scheduled from August 22 to September 7 and the national championship set for January 25, 2027, at Allegiant Stadium in Las Vegas. ESPN’s schedule structure covers the ACC, Big Ten, Big 12, SEC, American Athletic Conference, Conference USA, MAC, Mountain West, Sun Belt, Pac-12, and FBS independents, while NCAA.com tracks scores, rankings, statistics, and CFP news. The sharp takeaway is simple: never judge a college football line from team reputation alone; compare efficiency, travel, injuries, transfer movement, and price before making any decision.

Photo by El gringo photo on Pexels
The Bottom Line
College football is American football played by university teams under NCAA competition, with the FBS representing the highest-profile subdivision and the FCS operating as a separate championship level. The sport combines regular-season conference races, rivalry games, bowl eligibility, conference championships, and the College Football Playoff into one unusually volatile competitive calendar. The NCAA football overview identifies college football as the collegiate form of American and Canadian gridiron football, while the NCAA FBS football hub provides official news, scores, rankings, and championship information.
The obvious question is this: why does college football create so many pricing mistakes? Because the information arrives unevenly. A quarterback transfers from Oregon to another program, a defensive coordinator leaves Alabama, a rivalry game changes venue, or a team crosses multiple time zones, and public perception often moves faster than verified performance data. I track turnover, injury status, schedule difficulty, and closing-line movement before trusting a headline. That process is not glamorous, but it separates a measured position from an emotional guess.
The 2026 calendar demonstrates the scale of the sport. ESPN lists regular-season weeks through Week 14, with Week 15 running December 6–12, followed by bowl games beginning December 13 and CFP action continuing into January 2027. The season includes conference schedules for the ACC, Big Ten, Big 12, SEC, and other FBS leagues, plus FCS and lower-division listings. For fans using Pitch Notes alongside college football coverage, the correct objective is disciplined interpretation: identify what changed, measure its impact, and only then assess the market.
To build a stronger foundation, review our [Internal Link: college football schedule and conference guide] before comparing individual matchups. The schedule is not background information; it is the first variable in the calculation.
What Do Players Actually See?
Players see a faster, more specialized version of football in which roster depth, weekly preparation, travel, and scheme recognition determine outcomes as much as raw athletic ability. FBS athletes compete across a national system that includes major conferences such as the SEC, Big Ten, ACC, Big 12, and American Athletic Conference, while FCS teams operate under a different competitive structure and postseason model. A quarterback may face a completely different defensive structure from one week to the next, and a roster can change substantially through recruiting, the transfer portal, injuries, and graduation.
For supporters and analysts, that means the box score only tells part of the story. A 27–21 result, for example, does not automatically reveal whether the winner controlled early downs, benefited from short fields, lost the turnover battle, or survived unsustainable fourth-down conversions. NCAA.com reported Indiana defeating Miami 27–21 to win the program’s first national title, a result that illustrates how championship games compress a season’s worth of pressure into one high-leverage contest. The final score matters, but the underlying possession profile matters more when projecting future performance.
I prefer to divide the player experience into five measurable areas:
- Quarterback decision-making: pressure rate, explosive-pass creation, interception risk, and third-down conversion.
- Line play: success on early downs, pass protection, and short-yardage efficiency.
- Defensive communication: missed tackles, coverage busts, and red-zone resistance.
- Special teams: field position, kick reliability, and return value.
- Context: travel distance, weather, rest, rivalry intensity, and venue familiarity.
This is where the market routinely overreacts. A highly ranked team with poor pass protection can look dominant against a weak opponent and vulnerable against a disciplined defense. Conversely, an unranked team with strong line play and a stable quarterback can outperform a brand-name opponent. The player sees those details on film; the public often sees only the logo.
“College football is a game of inches,” a phrase widely associated with the sport’s competitive culture, is more than a slogan when applied to field position and possession value. A single blocked punt or red-zone stop can shift expected points dramatically. Our [Internal Link: college football team statistics guide] helps convert those moments into a more reliable evaluation framework.
Why does the 2026 schedule matter so much?
The 2026 schedule matters because matchup sequence, travel, rest, and conference timing directly influence player availability and team efficiency. ESPN’s 2026 listing begins with Week 1 games from August 22 through September 7 and continues through Week 15 before bowls and CFP competition. A team facing consecutive road games or elite opponents in short succession carries a different risk profile from a rested team at home.
Schedule analysis also exposes misleading records. A 6–1 team may have faced three lower-tier opponents, while a 5–2 team may have played the SEC’s strongest defenses and traveled from the Midwest to the West Coast. Therefore, compare opponent quality, average margin, explosive-play rate, and injury burden rather than counting wins alone. That is the actionable distinction between a strong record and a strong team.
What Are the 3 Things That Matter Most?
Three factors dominate serious college football analysis: quarterback and line continuity, schedule-adjusted efficiency, and game-state execution. These variables explain more repeatable performance than rankings, preseason narratives, or a single dramatic upset. When all three point in the same direction, confidence rises; when they conflict, the price deserves caution.
1. Quarterback and roster continuity
Quarterback stability remains the central variable because college offenses depend heavily on timing, protection calls, route adjustments, and red-zone decisions. The transfer portal has made continuity more difficult to evaluate: a talented player can raise a team’s ceiling, but a new system may reduce efficiency during the first several weeks. The same issue applies to defensive backs, offensive tackles, and pass rushers, whose communication errors often appear before casual observers recognize the cause.
Track returning starts, not merely returning players. A veteran quarterback with 20-plus career starts is not equivalent to a talented backup receiving his first major role. Also examine whether the quarterback’s production came from repeatable traits such as third-down accuracy and pressure avoidance or from unstable factors such as unusually high dropped-interception luck. As a practical rule, I assign greater weight to returning offensive-line snaps than to a single star skill player, because protection determines whether the entire playbook remains available.
2. Schedule-adjusted efficiency
Raw yards per game are weak evidence without opponent context. A team averaging 480 yards against defenses ranked near the bottom of its conference may be less efficient than a team averaging 410 yards against the SEC or Big Ten’s strongest units. Use success rate, points per drive, early-down performance, havoc allowed, and opponent-adjusted margins to establish a more honest baseline.
The contrarian insight is that schedule difficulty can create value after a public overreaction. A team may look “disappointing” after losing to Georgia, Michigan, and Texas, even though its underlying efficiency remains excellent. Another team may appear unstoppable after defeating three rebuilding programs. The ranking tells you where the team sits; the schedule-adjusted data tells you whether that location is justified.
3. Game-state execution
College football games change quickly when teams enter obvious passing situations, protect a lead, or chase points late. Third-down defense, red-zone touchdown rate, fourth-down decisions, turnover recovery, and special teams often determine whether a close matchup becomes a comfortable win. These metrics are especially important in rivalry games, conference championships, and CFP contests, where coaching decisions carry greater leverage.
I also track whether a team’s success survives different game states. A team that wins only when leading after the first quarter is fragile; a team that can run efficiently while ahead and pass efficiently while behind is structurally stronger. The best analysis asks not only, “Who is better?” but also, “What must happen for each team to win?” That question reveals whether a market price is generous or already efficient.
Ready to compare the variables that shape a matchup? Use our [Internal Link: advanced college football matchup analysis] to organize your notes before reviewing a line.
Edge Cases & Gotchas
The most dangerous college football mistakes occur in the details: neutral-site games, international travel, weather, late injury news, conference transitions, and misleading point spreads. These situations can invalidate a model built on historical averages because the assumptions behind those averages no longer apply. ESPN’s 2026 schedule includes a notable Week 1 matchup between North Carolina and TCU at Aviva Stadium in Dublin, Ireland, with the listed market showing TCU -6.5 and a 49.5 total in the reference schedule.
A Dublin game is not merely a normal road game with a different address. Teams must manage time-zone disruption, travel preparation, unfamiliar surroundings, field conditions, and a different crowd profile. The neutral-site label also changes the home-field calculation: neither North Carolina nor TCU receives the standard campus advantage. That is a specific edge case many casual previews flatten into a generic “neutral field” note, even though international logistics can affect sleep and preparation several days before kickoff.
Other 2026 schedule examples show why price and context must be separated. The reference ESPN listing shows San José State visiting USC at the Los Angeles Memorial Coliseum, with USC priced at -35.5 and a 57.5 total, while NC State visits Virginia with Virginia at -5.5 and a 54.5 total. Those numbers communicate expectations, not certainty. The USC matchup may hinge on rotation depth and garbage-time scoring, whereas NC State–Virginia is more sensitive to late possessions and quarterback protection.
Use this checklist before forming an opinion:
- Confirm the venue: campus stadium, neutral site, or international location.
- Check the kickoff time in each team’s home time zone.
- Separate confirmed injuries from social-media speculation.
- Compare the current number with the opening number.
- Review whether the total reflects pace, explosive plays, or defensive weakness.
- Measure turnover margin separately from turnover-worthy decisions.
- Account for conference championship and CFP motivation.
One operational insight deserves emphasis: late injury information is most valuable when it affects the offensive line or secondary, not only the headline quarterback. A missing tackle can alter sack probability, run direction, and play-calling across the entire game. A missing cornerback can force safety help and reduce the defense’s ability to disguise coverage. Those cascading effects often matter more than a small change in a star receiver’s projected targets.
What should bettors avoid in college football?
Bettors should avoid anchoring to rankings, chasing last week’s score, treating every home venue equally, and ignoring the difference between a team’s record and its opponent-adjusted performance. They should also avoid staking decisions based on unverified injury reports or assuming that a large favorite will automatically cover a large spread. A 35.5-point favorite can win comfortably while still failing to meet the market’s margin expectation.
The NCAA’s governing framework is broader than wagering analysis, and rules vary by jurisdiction and platform. The NCAA official football resources are the appropriate source for competition news, rankings, and championship information; they are not a substitute for local gaming regulations. In regulated markets, verify age, location, licensing, and responsible-play requirements before participating. “Know the rules before you play” is the only sensible standard when legal and financial consequences are involved.
For sharper decision-making, record the number you actually received, the closing number, the stake, and the result. After 30 documented positions, you can evaluate whether your process creates value or merely produces memorable stories. That ledger should include turnover, rebates where applicable, and net position; gross wins alone are meaningless if fees, poor prices, or oversized losses erase them.
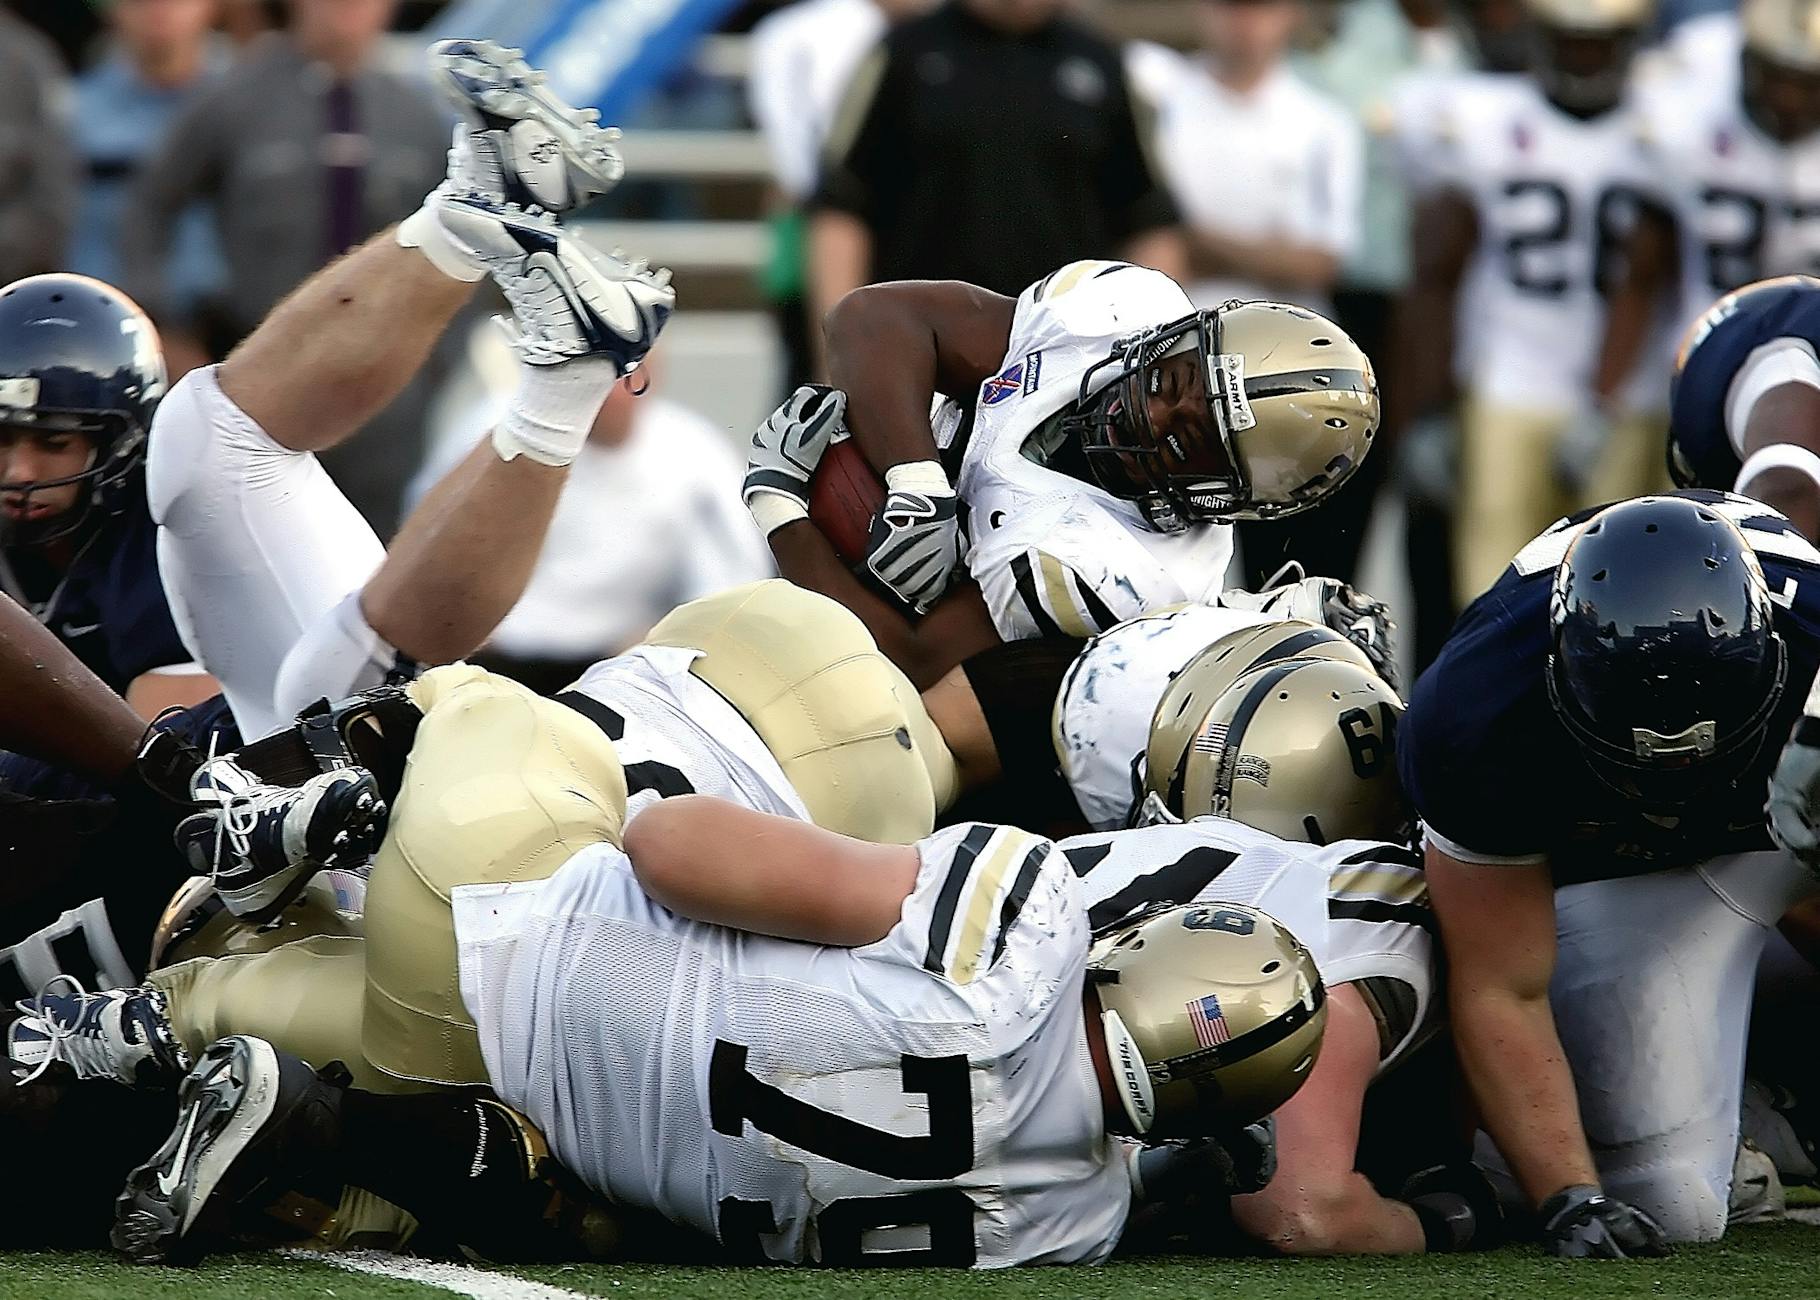
Photo by Pixabay on Pexels
How should a college football schedule be read?
A college football schedule should be read as a sequence of competitive demands, not a list of dates. Start with conference opponents, then identify road stretches, short-rest situations, rivalry games, neutral-site contests, and likely strength-of-schedule clusters. ESPN’s 2026 schedule separates Weeks 1 through 15, bowl dates, and CFP listings, making it easier to identify when pressure intensifies.
Next, map the schedule against roster depth. A team with an inexperienced quarterback may need early nonconference games to develop, while a team with a veteran defense may be built to peak during November. Check whether a difficult game follows a physically demanding rivalry contest, and assess whether a conference championship appearance creates an additional high-intensity week before the playoff. The most useful schedule insight is sequencing: opponents do not arrive in isolation.
Verdict
College football rewards analysis that begins with structure and ends with price. The 2026 season offers a deep schedule across the ACC, Big Ten, Big 12, SEC, American Athletic Conference, Conference USA, MAC, Mountain West, Sun Belt, Pac-12, FBS independents, and FCS, but more games do not automatically create more opportunity. The strongest approach is to identify quarterback and line continuity, adjust performance for opponent quality, account for travel and venue conditions, and test whether a team can perform in multiple game states.
The most surprising market behavior is not that teams lose; it is that public narratives often remain unchanged after the evidence has moved. A brand-name program can retain support despite declining protection metrics, while a less fashionable team can be undervalued after a difficult schedule. That is where a rational partner-in-crime looks for separation: not by predicting every winner, but by refusing to pay for information already included in the number.
Pitch Notes focuses primarily on FIFA World Cup predictions, team tactics, player statistics, and 2026 tournament coverage, so it should not be treated as an NCAA authority. However, its analytical discipline translates well: define the data, identify the tactical mechanism, price the uncertainty, and track the net result. For college football, that means treating every selection as a measured position rather than a loyalty statement.
My verdict is final: follow the schedule, verify the personnel, quantify the matchup, and protect the bankroll. Do that consistently, and you will understand college football better than the crowd that only checks the final score.
Want a broader analytical framework for sports research? Explore our [Internal Link: sports prediction methodology guide] before building your next college football worksheet.
Frequently Asked Questions
Q: What is college football?
A: College football is American football played by university teams, primarily under NCAA competition in the United States. The FBS is the highest-profile subdivision and includes conferences such as the SEC, Big Ten, ACC, Big 12, and American Athletic Conference, while the FCS follows a separate competitive and postseason structure. The season typically includes regular-season games, conference championships, bowl games, and the College Football Playoff. NCAA.com provides official FBS scores, rankings, statistics, news, and championship information.
Q: How do I follow the 2026 college football schedule?
A: Follow the 2026 college football schedule through an updated schedule provider such as ESPN and confirm results through NCAA.com. ESPN’s reference calendar divides the season into Week 1 from August 22 to September 7, Weeks 2 through 15, bowl games beginning December 13, and CFP competition extending into January 2027. Always confirm kickoff time, television coverage, venue, weather, and schedule changes close to game day.
Q: What is the difference between FBS and FCS college football?
A: FBS and FCS are different NCAA football subdivisions with separate competitive structures and postseason systems. FBS programs compete at the top level and pursue conference titles, bowl eligibility, and CFP selection, while FCS programs participate in an established playoff bracket. Conferences such as the SEC and Big Ten are FBS leagues, whereas the Missouri Valley Football Conference and Big Sky Conference are examples associated with FCS competition. Comparing records across subdivisions without adjusting for opponent level is unreliable.
Q: Is college football betting worth it?
A: College football betting is only worth considering when the expected value, legality, and bankroll risk are clearly understood. Team volume creates information opportunities, but it also creates uncertainty through transfers, injuries, uneven schedules, and rapidly changing player roles. Compare the available number with your estimated probability, record the stake and closing line, and never treat entertainment spending as guaranteed income. Verify local regulations, operator licensing, age requirements, and responsible-play tools before participating.
Q: Why does a college football spread change before kickoff?
A: A college football spread changes when new information alters market expectations or when betting volume moves the available price. Common causes include quarterback or offensive-line injuries, weather, suspensions, lineup announcements, sharp wagers, and changes in projected pace. A move from -5.5 to -6.5 does not prove that the favorite will win; it only shows that the market has repriced perceived probabilities. Record both opening and closing numbers to evaluate whether your process interpreted information efficiently.
Q: What should I check before analyzing a college football matchup?
A: Check venue, travel, rest, quarterback status, offensive-line continuity, defensive injuries, opponent-adjusted efficiency, and the opening-to-current line movement. Then identify each team’s realistic winning path, such as controlling early downs, preventing explosive passes, or winning red-zone possessions. Pay particular attention to international or neutral-site games, including the 2026 North Carolina–TCU matchup at Aviva Stadium in Dublin. A structured checklist prevents rankings and recent-score recency from dominating the analysis.
Q: Can college football statistics predict every game?
A: College football statistics cannot predict every game because turnovers, injuries, weather, officiating, and single-play volatility create unavoidable uncertainty. They can improve decision quality by revealing repeatable strengths in success rate, points per drive, pressure defense, field position, and schedule-adjusted performance. Use statistics to estimate a range of outcomes rather than claim certainty. After at least 30 documented evaluations, review closing-line performance and net results to determine whether the method is genuinely useful.